Originally published on March 11, 2012
Much has been made of the 227,000 jobs estimated to have been added to the US economy in February 2012 according to the Bureau of Labor Statistics (see, for example, this New York Times article from Friday). This is a good number – anything greater than 150,000 generally results in a sigh of relief amongst economists – and better than expected. For example, the Survey of Professional Forecasters released in the middle of February forecasted only 160,000 jobs to be created per month on average for the first three months of 2012. Given that the January numbers were also revised up to 284,000, it looks like the forecasters are going to be way off this quarter (although they were even more pessimistic back in November – they had previously forecast only 121,000 jobs to be added per month for the first quarter of 2012). These numbers are still well below what we’re used to seeing in a robust recovery, where monthly job creation on the order of 500,000 is not unusual, but they’re big enough that they more than cover new entrants to the labor market. This means it should be whittling away at the unemployment rate. So, why did the unemployment rate stay the same, at 8.3%, rather than drop? This is actually the good news I have been waiting for.
Why would I possibly argue that an unemployment rate staying at 8.3% is good news? Well, if jobs are being added but the unemployment rate isn’t dropping it means that more people must be out looking for jobs. This is why the unemployment rate tends to lag in recoveries – people get discouraged when the labor market looks rough and stop looking for work. As the economy starts to look better we may actually see the unemployment rate rise a bit with discouraged workers coming back into the labor market and again looking for jobs. This is an exciting development since it suggests there is a bit more optimism for the economy out there.
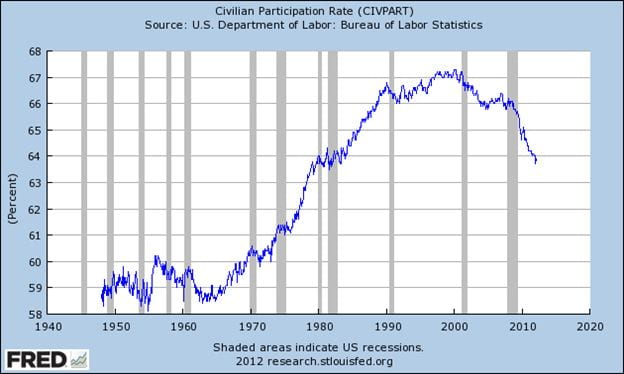
Here are a couple of graphs for thought. First, here’s the civilian participation rate, i.e. the percentage of the civilian population either employed or actively looking for a job:
As you can see, we have some way to go to get back to the peak of over 67% that we had in the late 1990s. There are some reasons we may not get back to that level, in particular the aging of the population resulting in a greater proportion of our population in retirement, but it seems like we might expect to get back to near 66%, where we were before the Great Recession. Currently we’re at only 63.9%. But, that’s a little tick up from January’s 63.7%. Hopefully that pattern will continue. But, that may mean stagnating unemployment rates for a while.
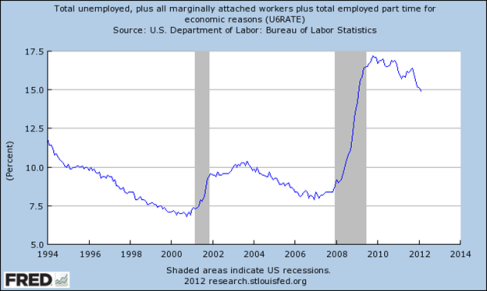
If we’re looking for discouraged workers going back to the labor market, perhaps we should instead look at a broader definition of the unemployment rate. Here is a graph of the U6 unemployment rate that includes discouraged workers and those that have part time jobs but want full time jobs:
Here we can see a strong decline of late – this is the good news that is hidden in the more narrow unemployment rate. A number of people, including Paul Krugman, argued that this was the number we should be watching back in the recession. It may also be the right one to watch in the recovery.
I should mention a couple of other perspectives on the reduced participation rate over the last few years. The Economist magazine came out with an interesting article this week which discusses an argument from Alan Krueger, the chairman of the Council of Economic Advisers, that some of the discouraged workers went back to school so the lower participation rate of the last few years isn’t as bad as it may first appear. I wouldn’t, however, push that idea so far as to claim that the Great Recession was good for these individuals or for the economy as a whole. That would be similar to arguing that a tornado is good for a town because they get to rebuild a nicer town afterwards. If these people really thought that an education was going to make their lives better they could have gone to school instead of working – they originally made the choice to work instead of going to school. I generally believe people know best about their life choices. There may be some reasons to question that belief, but I think it’s a good place to start from. Still, in the face of unemployment they chose to expand their education instead of facing the possibility of long-term unemployment. This was probably a good choice for them and for the economy as a whole.
Returning to the relationship between labor force participation and the unemployment rate, one of my favorite blogs, the Federal Reserve Bank of Atlanta’s macroblog, had an interesting post on Friday. The Atlanta Fed has a cool new tool on their website called the Jobs Calculator that was designed to calculate the net employment change needed to achieve a target unemployment rate after a specified number of months, but it can also be used to do several other fun thought experiments. For example, in the blog post from Friday Julie Hotchkiss, an economist at the Atlanta Fed, used the Jobs Calculator to estimate what the unemployment rate would have been in February if there hadn’t been the tick up in the participation rate. She estimates that it would have been about 8%, about three tenths below what it was reported to be in February. I also find it interesting that the default settings show what the payroll numbers would need to be to keep the unemployment rate constant at its current value, holding constant the current participation rate. Apparently it’s now below 95,000 jobs per month. So, any month where we see job creation over that number means either the unemployment rate should fall or the participation rate has risen. Either one of those is good news.


